Introduction
Call logs are the central hub for reviewing completed and active calls. Every call made through Bland — outbound, inbound, voice, web, or SMS — surfaces here with its full transcript, audio recording, extracted variables, and per-turn decision data. Use call logs to debug agent behavior, review call quality, and feed real conversations into the testbed for prompt iteration.The Call Logs Table
Layout
The call logs page displays your calls in a table, sorted most recent first by default. Click any row to open a detail view of that call.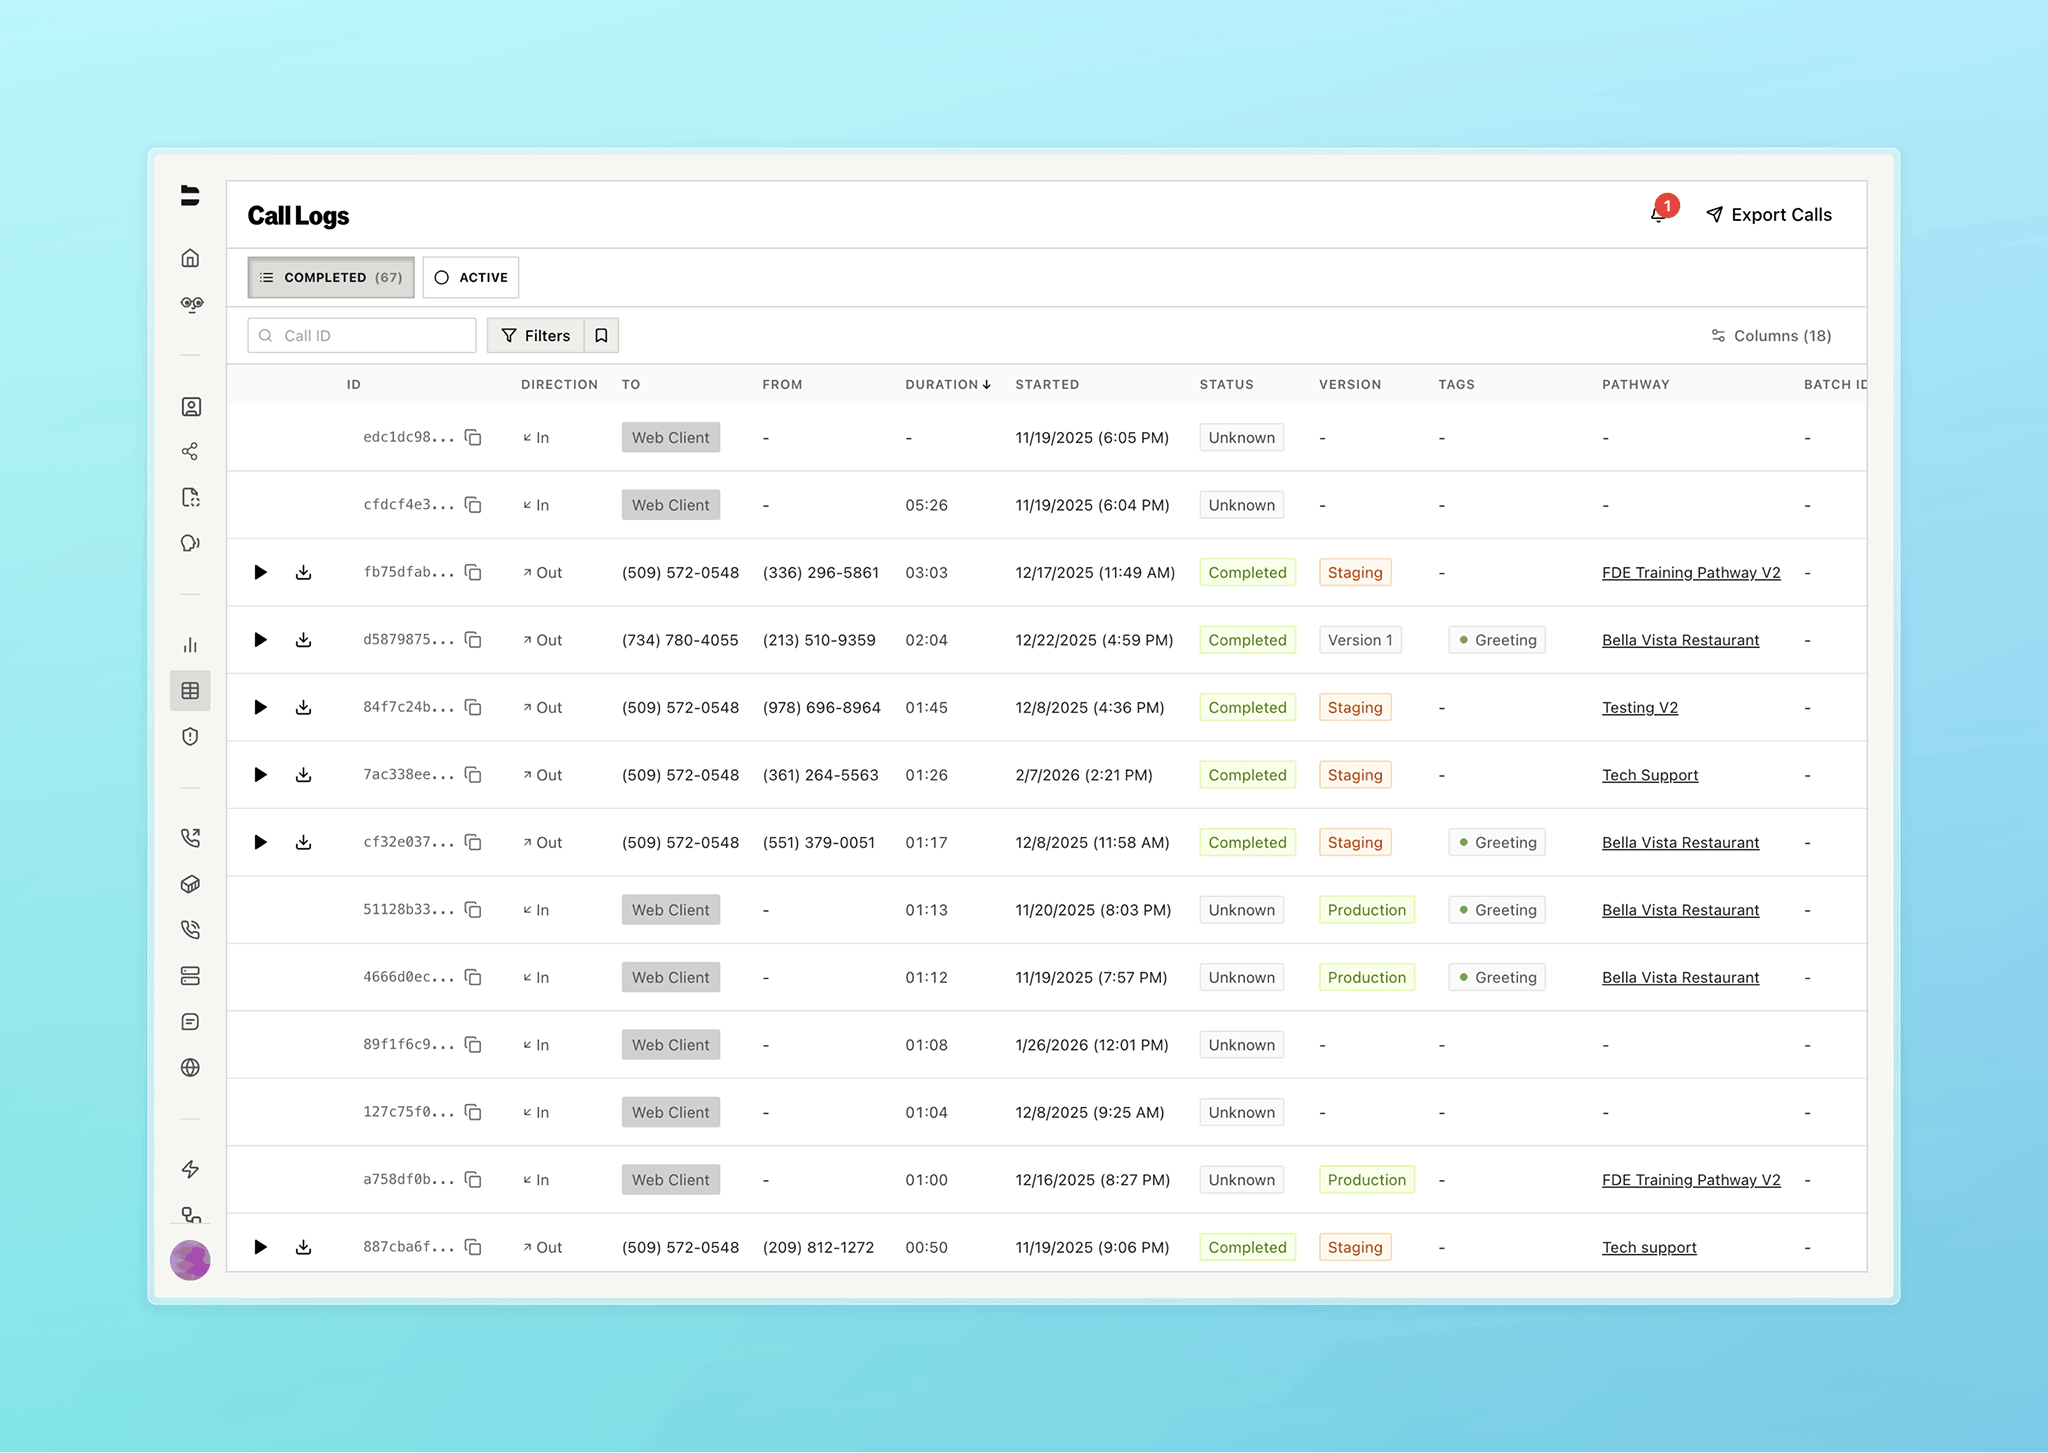
Columns
Columns are configurable — open the “Configure Columns” dropdown to toggle columns on or off and drag them to reorder.Warm Transfers in the Table
Calls with warm transfers show a “Proxy” expand button in the Direction column. Click it to reveal the proxy-agent sub-rows underneath the parent call. The Transferred To column shows the transfer state. For the full warm transfer feature, see Warm Transfers.Filtering
Click Filters to open the filter panel. Quick filters — Full Conversations, Voicemails, Assigned to Me, Warm Transfers, and Unassigned. Time range — Last 1 hour, Last 24 hours, Today, Last 7 days, or Last 30 days. Pathway filter — select one or more pathways to show only their calls. Advanced conditions let you build structured filters. Each row is a field, an operator, and a value. Add multiple rows and toggle between AND/OR logic. Available filtering parameters:
Saved filters — click the bookmark icon next to the Filters button to save, load, rename, or delete filter configurations. Saved filters are shared across your organization. When you have a saved filter loaded, you can “Update” it or “Save as new group.”
Filters encode in the URL, so you can share a filtered view by copying the page URL.
Search
You can search by Call ID from the table. To search within a transcript, open the call detail view — transcript search is available there.Export
Click Export Calls in the header to export your call data as a CSV delivered via email. Configure your export with:- Email — where to send the CSV (defaults to your account email)
- Timezone — for timestamp formatting
- Date range — up to 180 days
- Exclude columns — choose which fields to include or exclude (transcript, pathway_logs, citation_variables, memory, and more)
Notifications
The bell icon in the header shows your unread notification count. Notifications are generated when a call is assigned to you for review. Clicking a notification opens that specific call with the review tab active. For more on the review system, see Call Reviewing.Call Detail View
Click any call in the table to open its detail view. The detail view shows the transcript and audio player alongside a collapsible context panel with metadata, variables, citations, and more.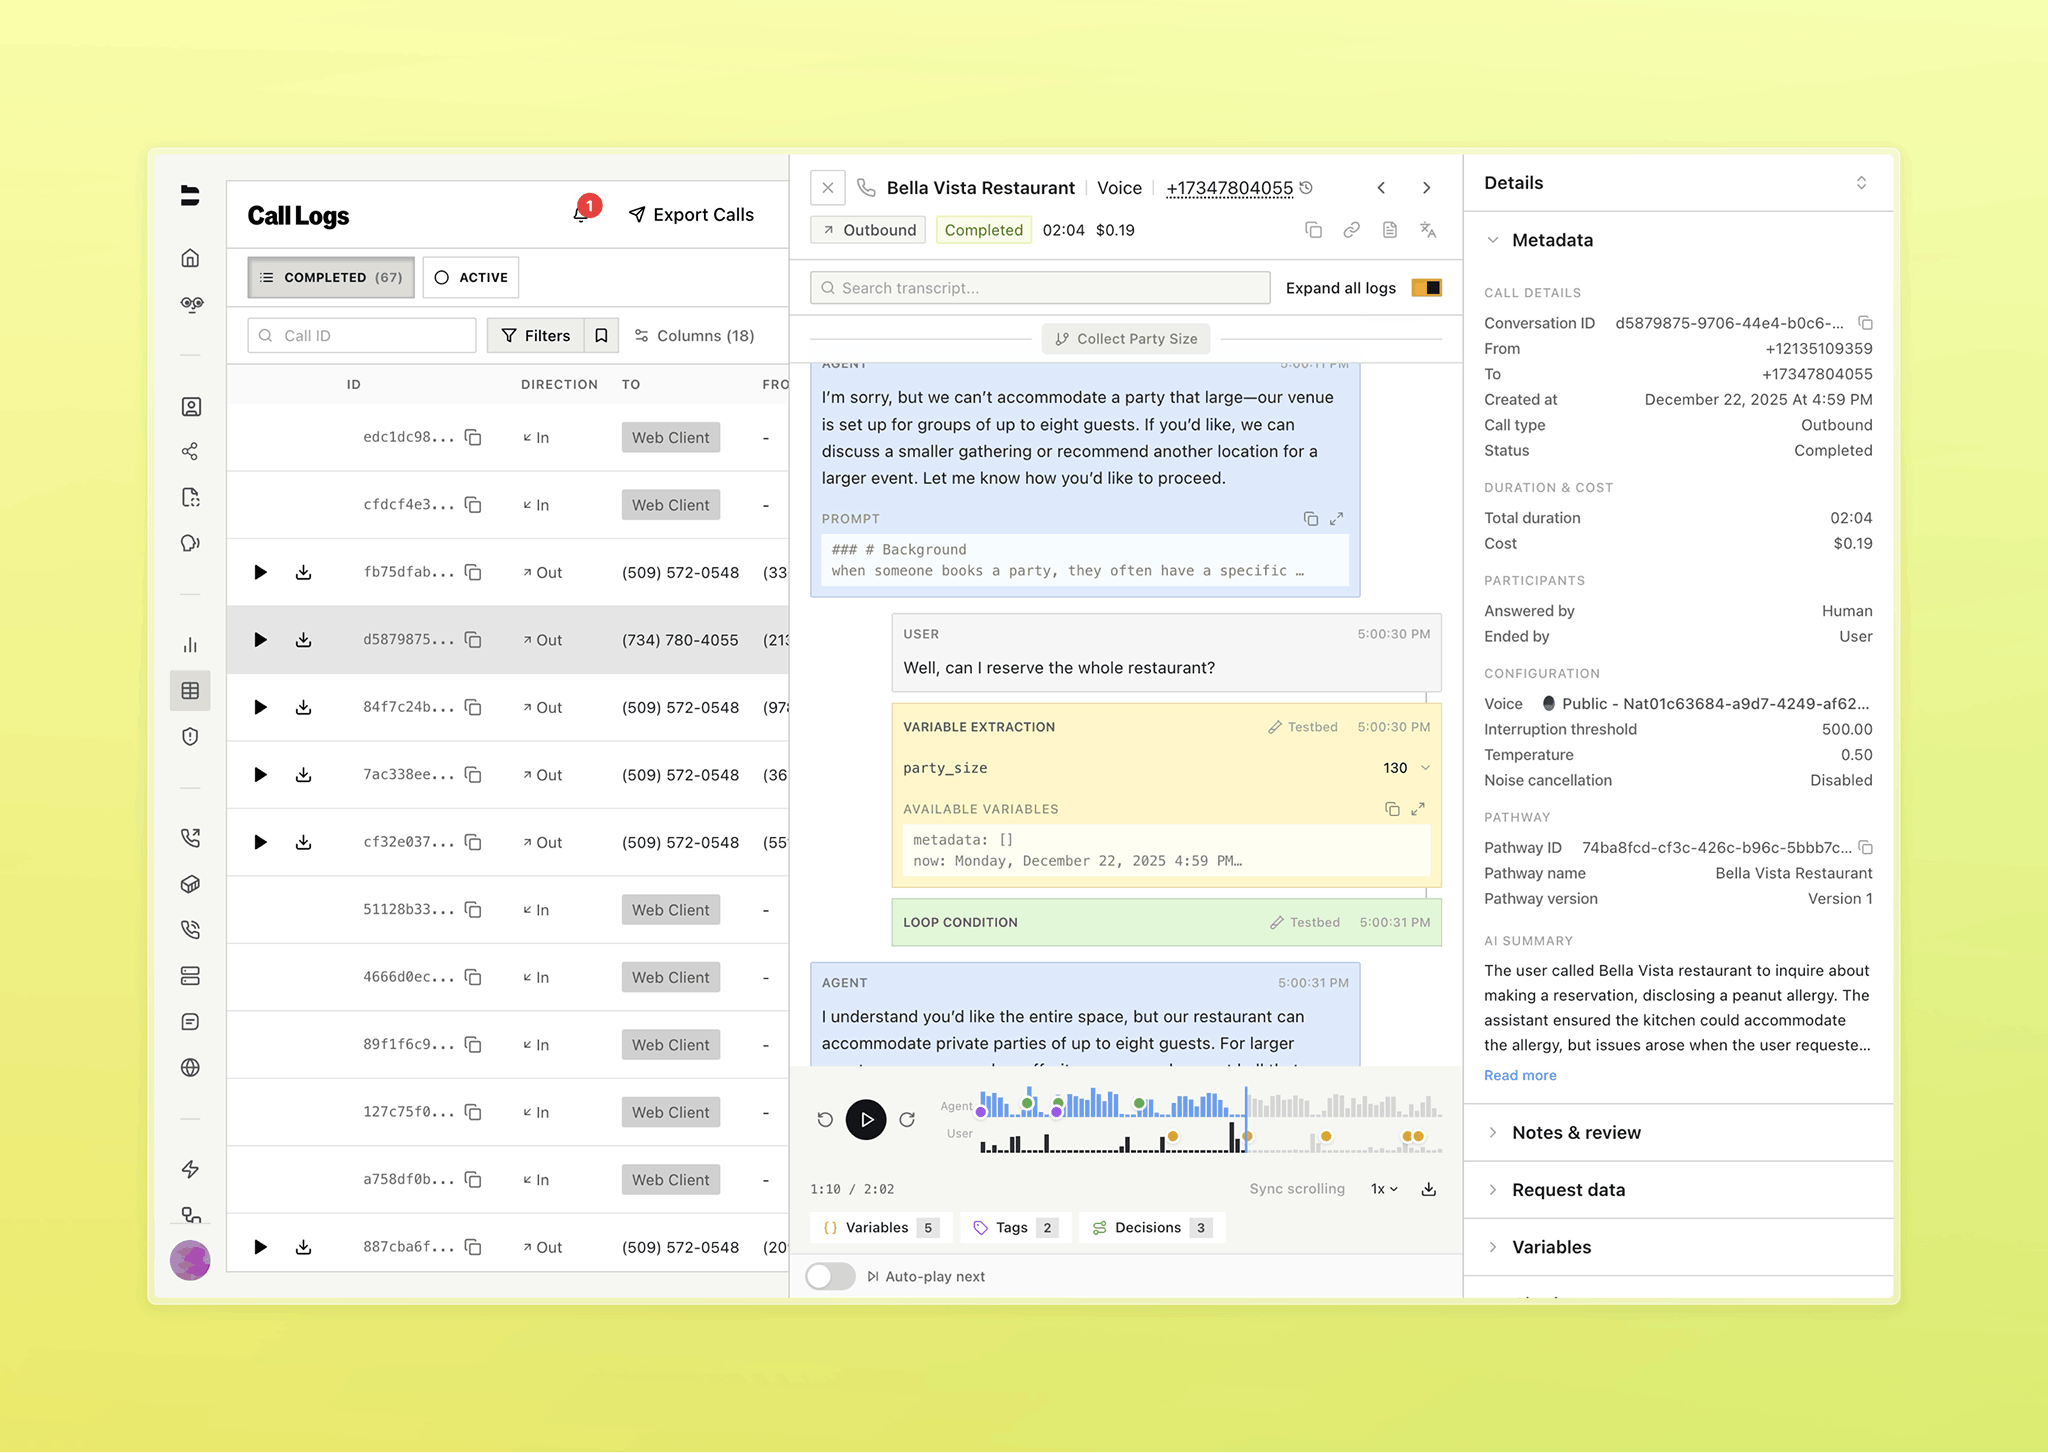
Header
The header shows the call’s channel (Voice, Web, or SMS), pathway name (click to open the editor), and the contact number. Clicking the contact number filters call logs to show all calls with that number — useful for viewing a contact’s history. Below that: direction badge, status, duration, and cost. Action buttons let you copy the call ID, copy the full transcript, or toggle translation.Transcript
The transcript shows the full conversation with speaker labels and timestamps. For pathway calls, a sticky header tracks which node you’ve scrolled past, so you always know where you are in the conversation flow. Transcript search — search for specific text within the transcript and step through matches. Translation — toggle the translate button in the header to translate the transcript. Hover actions appear on each transcript bubble:- Flag — report a transcript quality issue (speech-to-text or text-to-speech). Flagged entries show an amber indicator.
- Edit node — open the pathway editor in a new tab, navigated directly to the node that generated this response.
- Testbed — open the testbed with this call’s context pre-loaded. See Testbed for the full workflow.
Expanded Logs
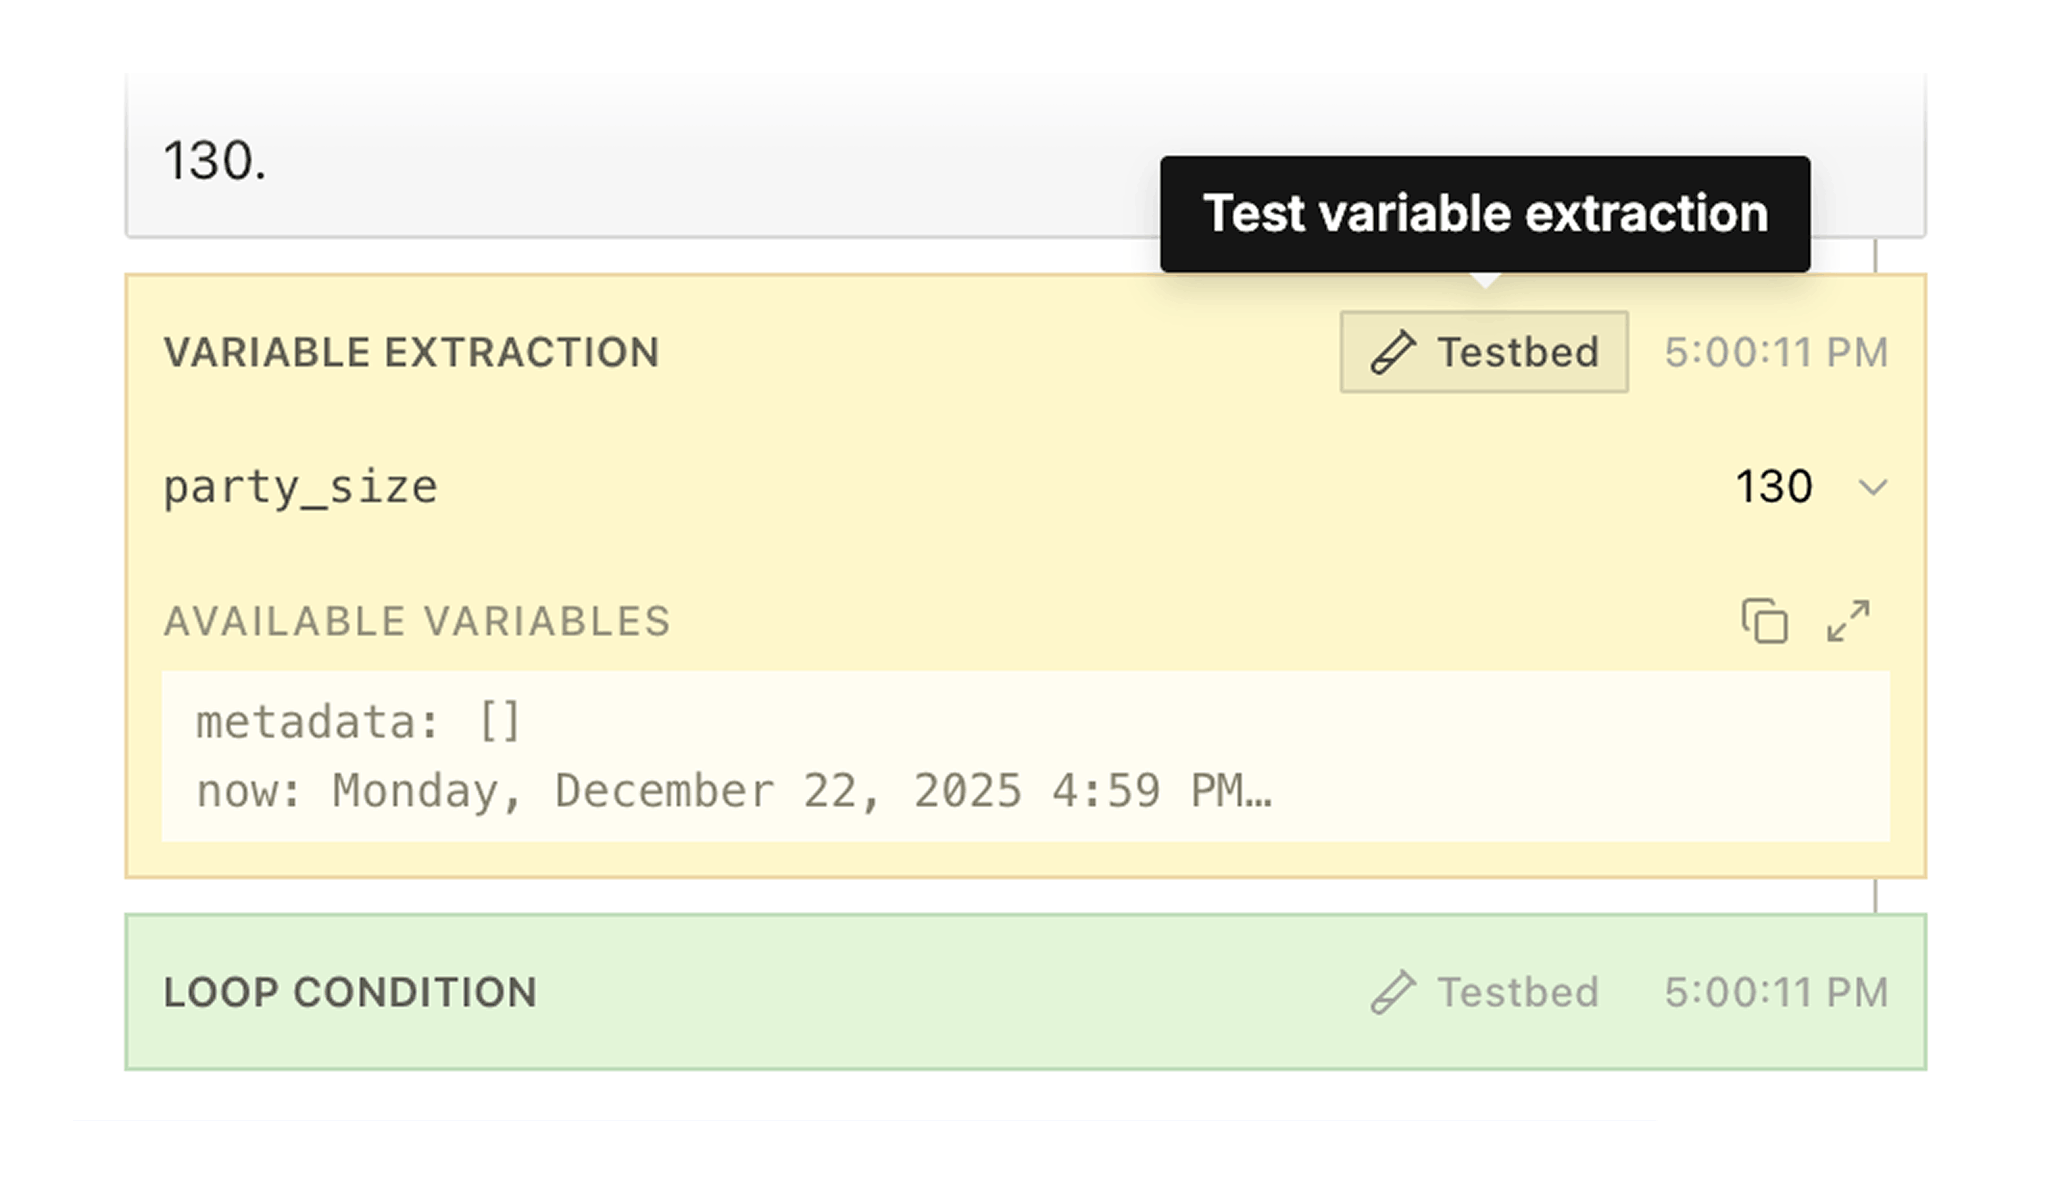
Toggle “Expand all logs” in the transcript toolbar to see per-turn decision data inline between dialogue turns. This is the primary debugging view for pathway calls — it shows exactly what the agent decided at each step of the conversation. Each turn can include the following log types: Node chosen — which pathway node the agent transitioned to at this point in the conversation. Prompt — the agent’s prompt text for this turn. Loop condition — whether the node’s loop condition was evaluated and its result. Shows the full condition prompt and a likelihood score (e.g., “Likely 7/10”). When the condition is not yet met, the agent stays on the current node. This is the only prompt shown directly in expanded logs — node prompts and the global prompt are accessible from the node editor. Routing — which outgoing route the agent chose, plus the other available options it could have taken. This lets you see not just what the agent did, but what it decided against. Variable extraction — the extraction type and results. Shows variable names and their extracted values (e.g.,party_size: 8, appointment_time: 9:30 AM). Also shows the full list of available variables from previous nodes and which node each variable originated from.
Webhook — for nodes that trigger webhooks: the URL, HTTP response status, response time, and the full response payload.
Other events — button presses, knowledge base tool calls, SMS events, custom code execution, scheduling, and transfer call events also appear in the expanded logs when relevant.
Loop condition and variable extraction entries include testbed buttons, so you can jump directly into testing from any decision point. See Testbed.
Audio Player
The audio player appears at the bottom of the detail view when a recording exists. Playback controls include play/pause, skip forward and back, a speed selector, and a download button. Sync scrolling — toggle this to link the audio playback position to the transcript. As the recording plays, the transcript auto-scrolls to the corresponding dialogue. Auto-play next — when enabled, the player automatically advances to the next call that has a recording when the current one finishes. The waveform displays colored marker dots at key moments in the call. Hover any marker for a tooltip showing its type, timestamp, and name. Click a marker to seek the audio to that point.- Pathway tags — tags you place on nodes in the pathway editor. When the agent navigates to a tagged node during a call, the tag appears as a marker on the waveform and as a chip in the Pathway Tags section of the context panel. Use them to track when your agent reaches important conversation milestones.
- Decision markers (green) — node transitions, showing when the agent moved between pathway nodes
- Extraction markers (amber) — variable extractions and citations, showing when data was pulled from the conversation
Context Panel
The context panel contains collapsible detail sections. Use the expand/collapse all toggle to open or close all sections at once. Metadata — organized into groups:- Call Details — conversation ID, from/to numbers, created timestamp, call type, status
- Duration & Cost — total duration, transfer duration (for transferred calls), cost
- Participants — caller location, answered by (human/voicemail), ended by (assistant/human)
- Configuration — language, voice, interruption threshold, temperature, noise cancellation
- Pathway — pathway ID, name (click to open the editor), version
- Alerts — error messages and silence warnings when detected
- AI Summary — auto-generated summary of the conversation, expandable
Docs for agents: llms.txt