How alerts work
Each alert is a configuration that combines three things:- A condition: what to measure on each call (a built-in metric or a custom signal).
- One or more severity levels: INFO, WARNING, and CRITICAL, each with its own threshold, percentage trigger, and lookback window.
- A delivery target: email, phone, or a custom tool to notify when a level fires.
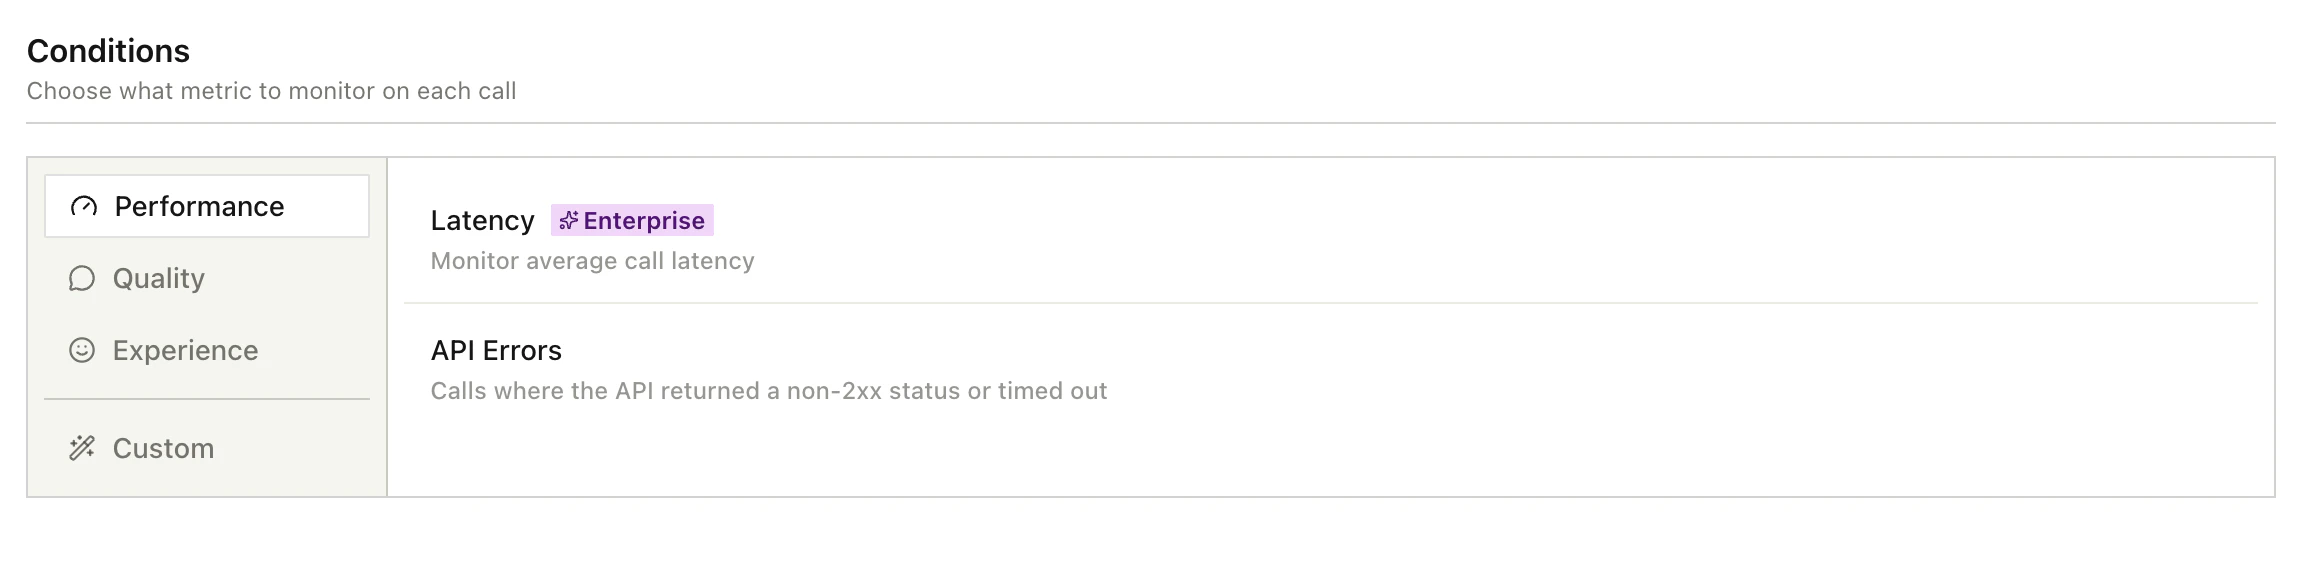
Conditions
Built-in metrics
Two metrics are available on every plan:- Call length: total duration of the call.
- API errors: calls where an API hit returned a non-2xx status or timed out.
- Latency: average response latency.
- Transcription score: speech-to-text confidence.
- Silence count: long pauses where neither party is speaking.
- Sentiment score: how the contact reacted during the call.
- Low engagement ratio: share of the call where the contact gave very short responses.
- User interruption count: how often the contact interrupted the agent.
Custom conditions
When the built-in metrics aren’t enough, write a custom condition in plain language (for example, “caller asked for a manager”). Custom conditions can also point at structured signals you already produce:- Citation variables: values extracted by a citation schema (e.g.
appointmentConfirmed: true). - Disposition fields: results from an outcome (e.g.
disposition.qualified === false). - Pathway tags: whether a specific tag was hit on the call.
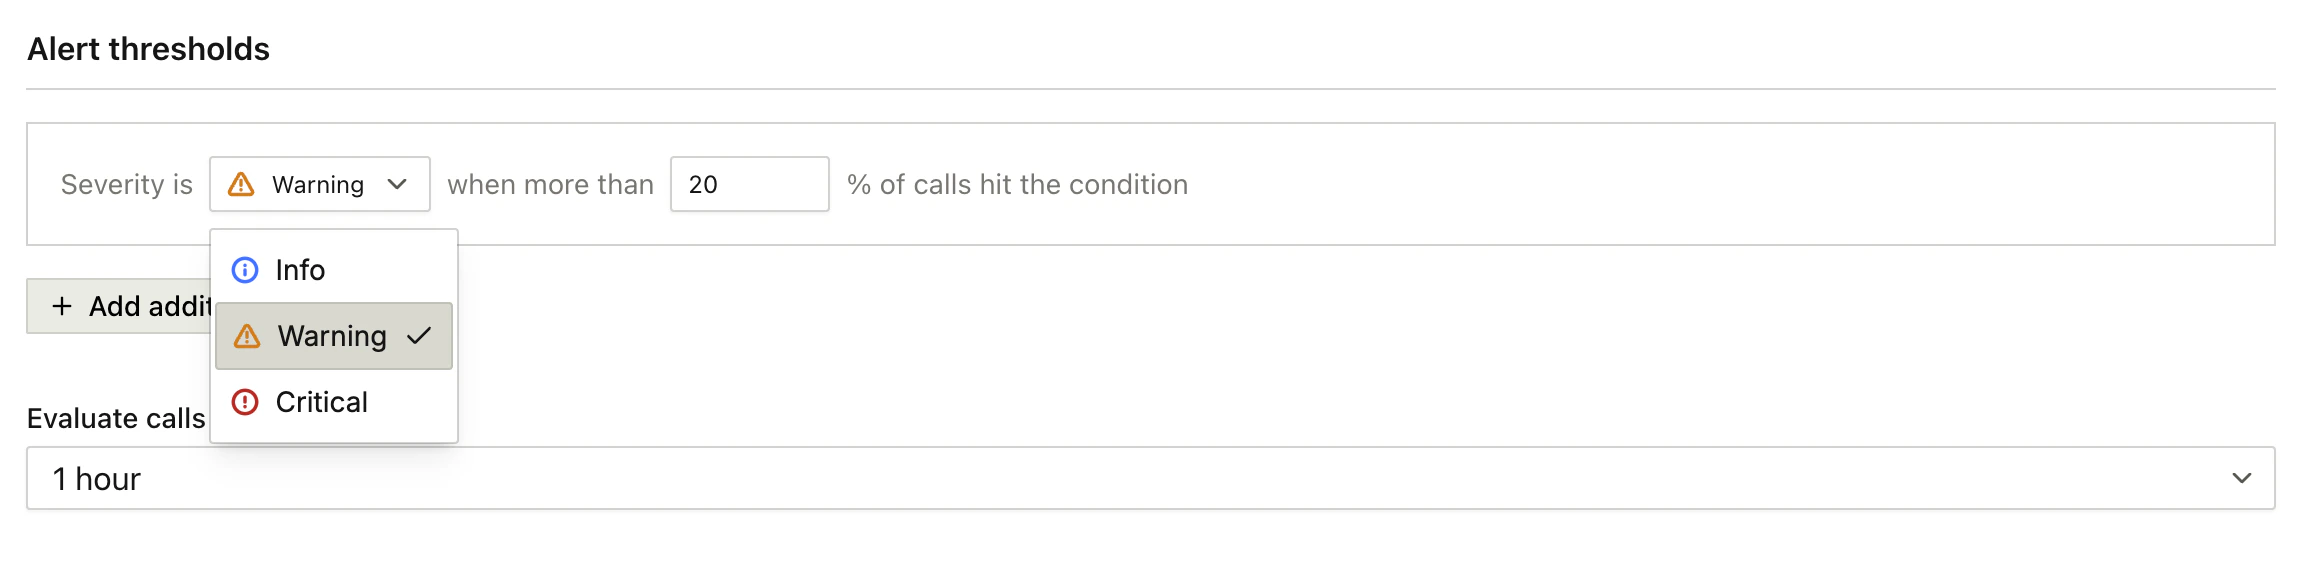
Severity levels
Every alert supports up to three levels:
Each level has its own:
- Operator and value: e.g.
call_length > 600s. - Percentage trigger: the share of calls in the window that must violate before the level fires (e.g. fire when 10% of calls exceed the threshold).
- Lookback window: how far back to look. Options are 10 minutes, 30 minutes, 1 hour, 3 hours, or 24 hours.
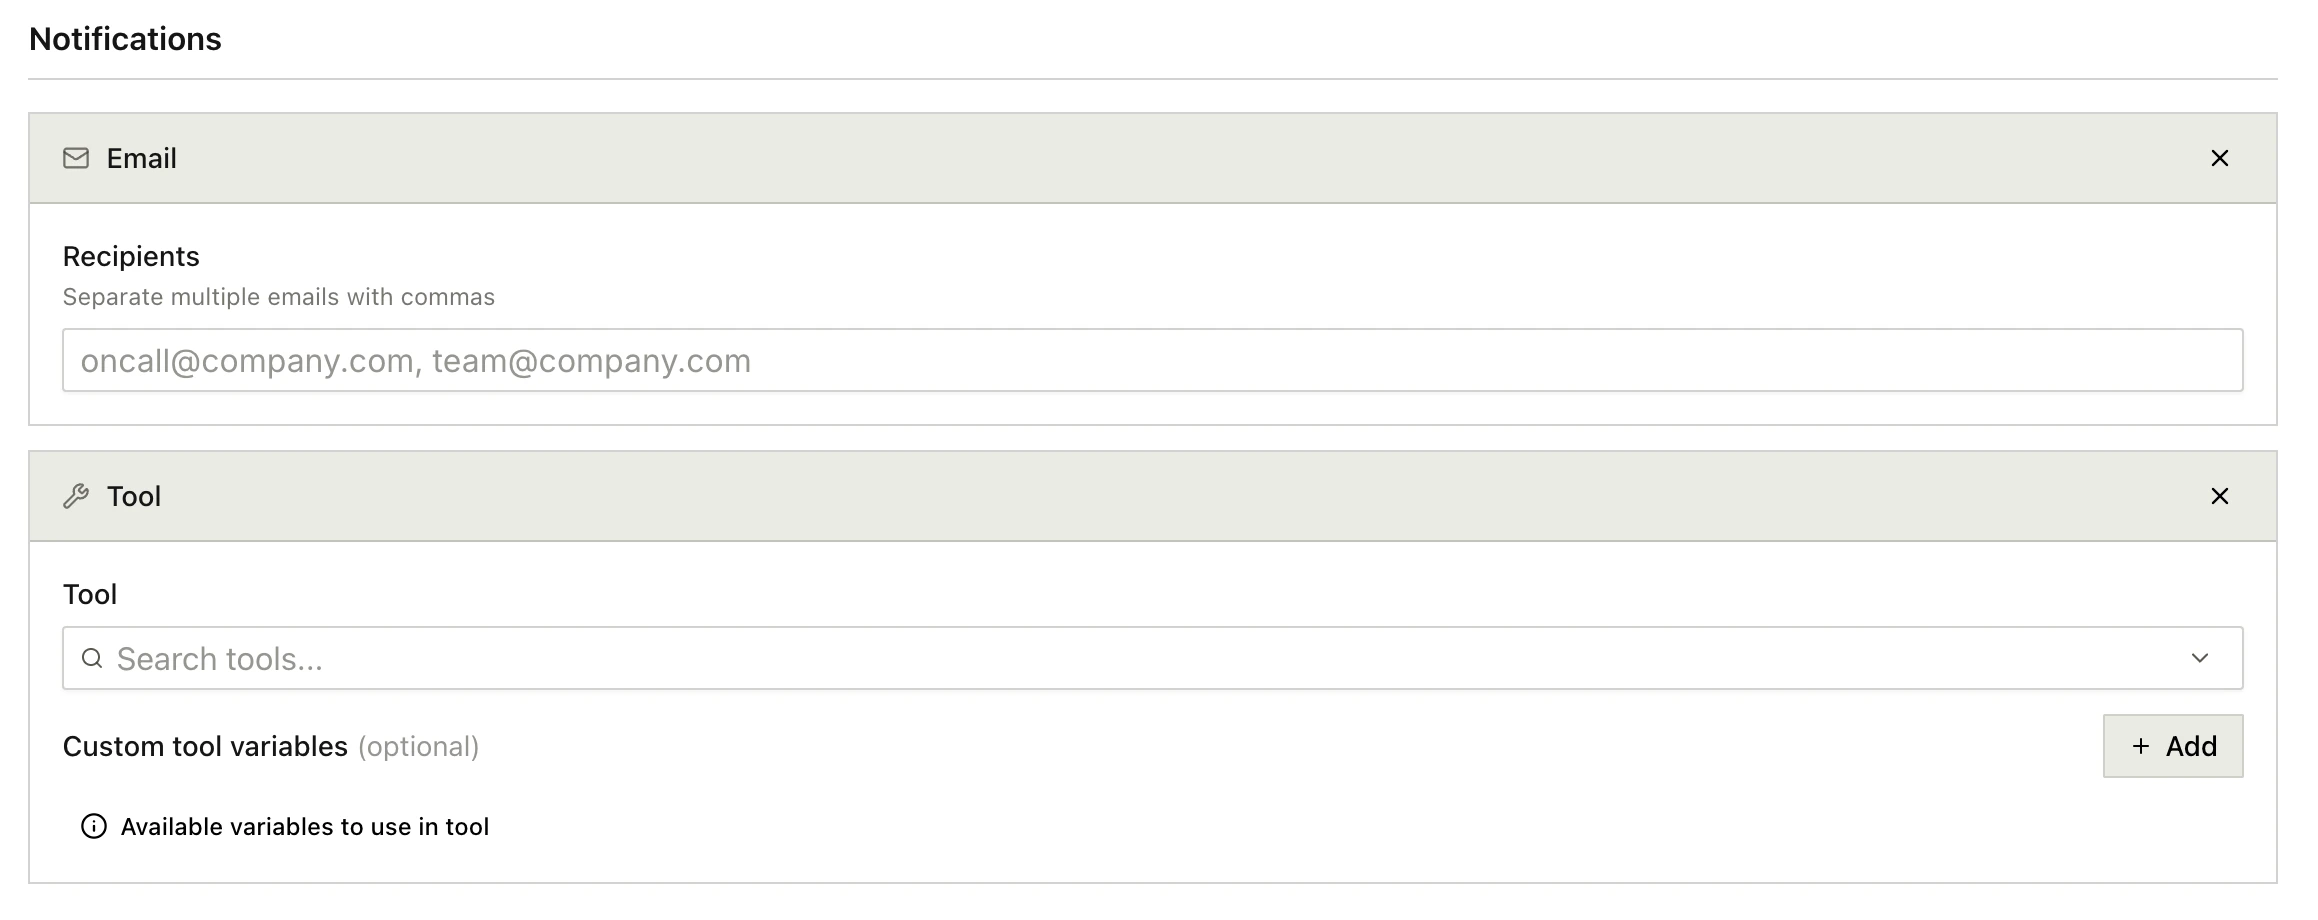
Notifications
When a level fires, the platform delivers a notification to any of the following:- Email: one or more email addresses.
- Phone: an outbound voice call to a list of numbers, optionally using a specific caller ID and a custom spoken message.
- Custom tool: invoke one of your custom tools with an input payload. Useful for routing to Slack, PagerDuty, a webhook, or anything else you’ve already wired up.
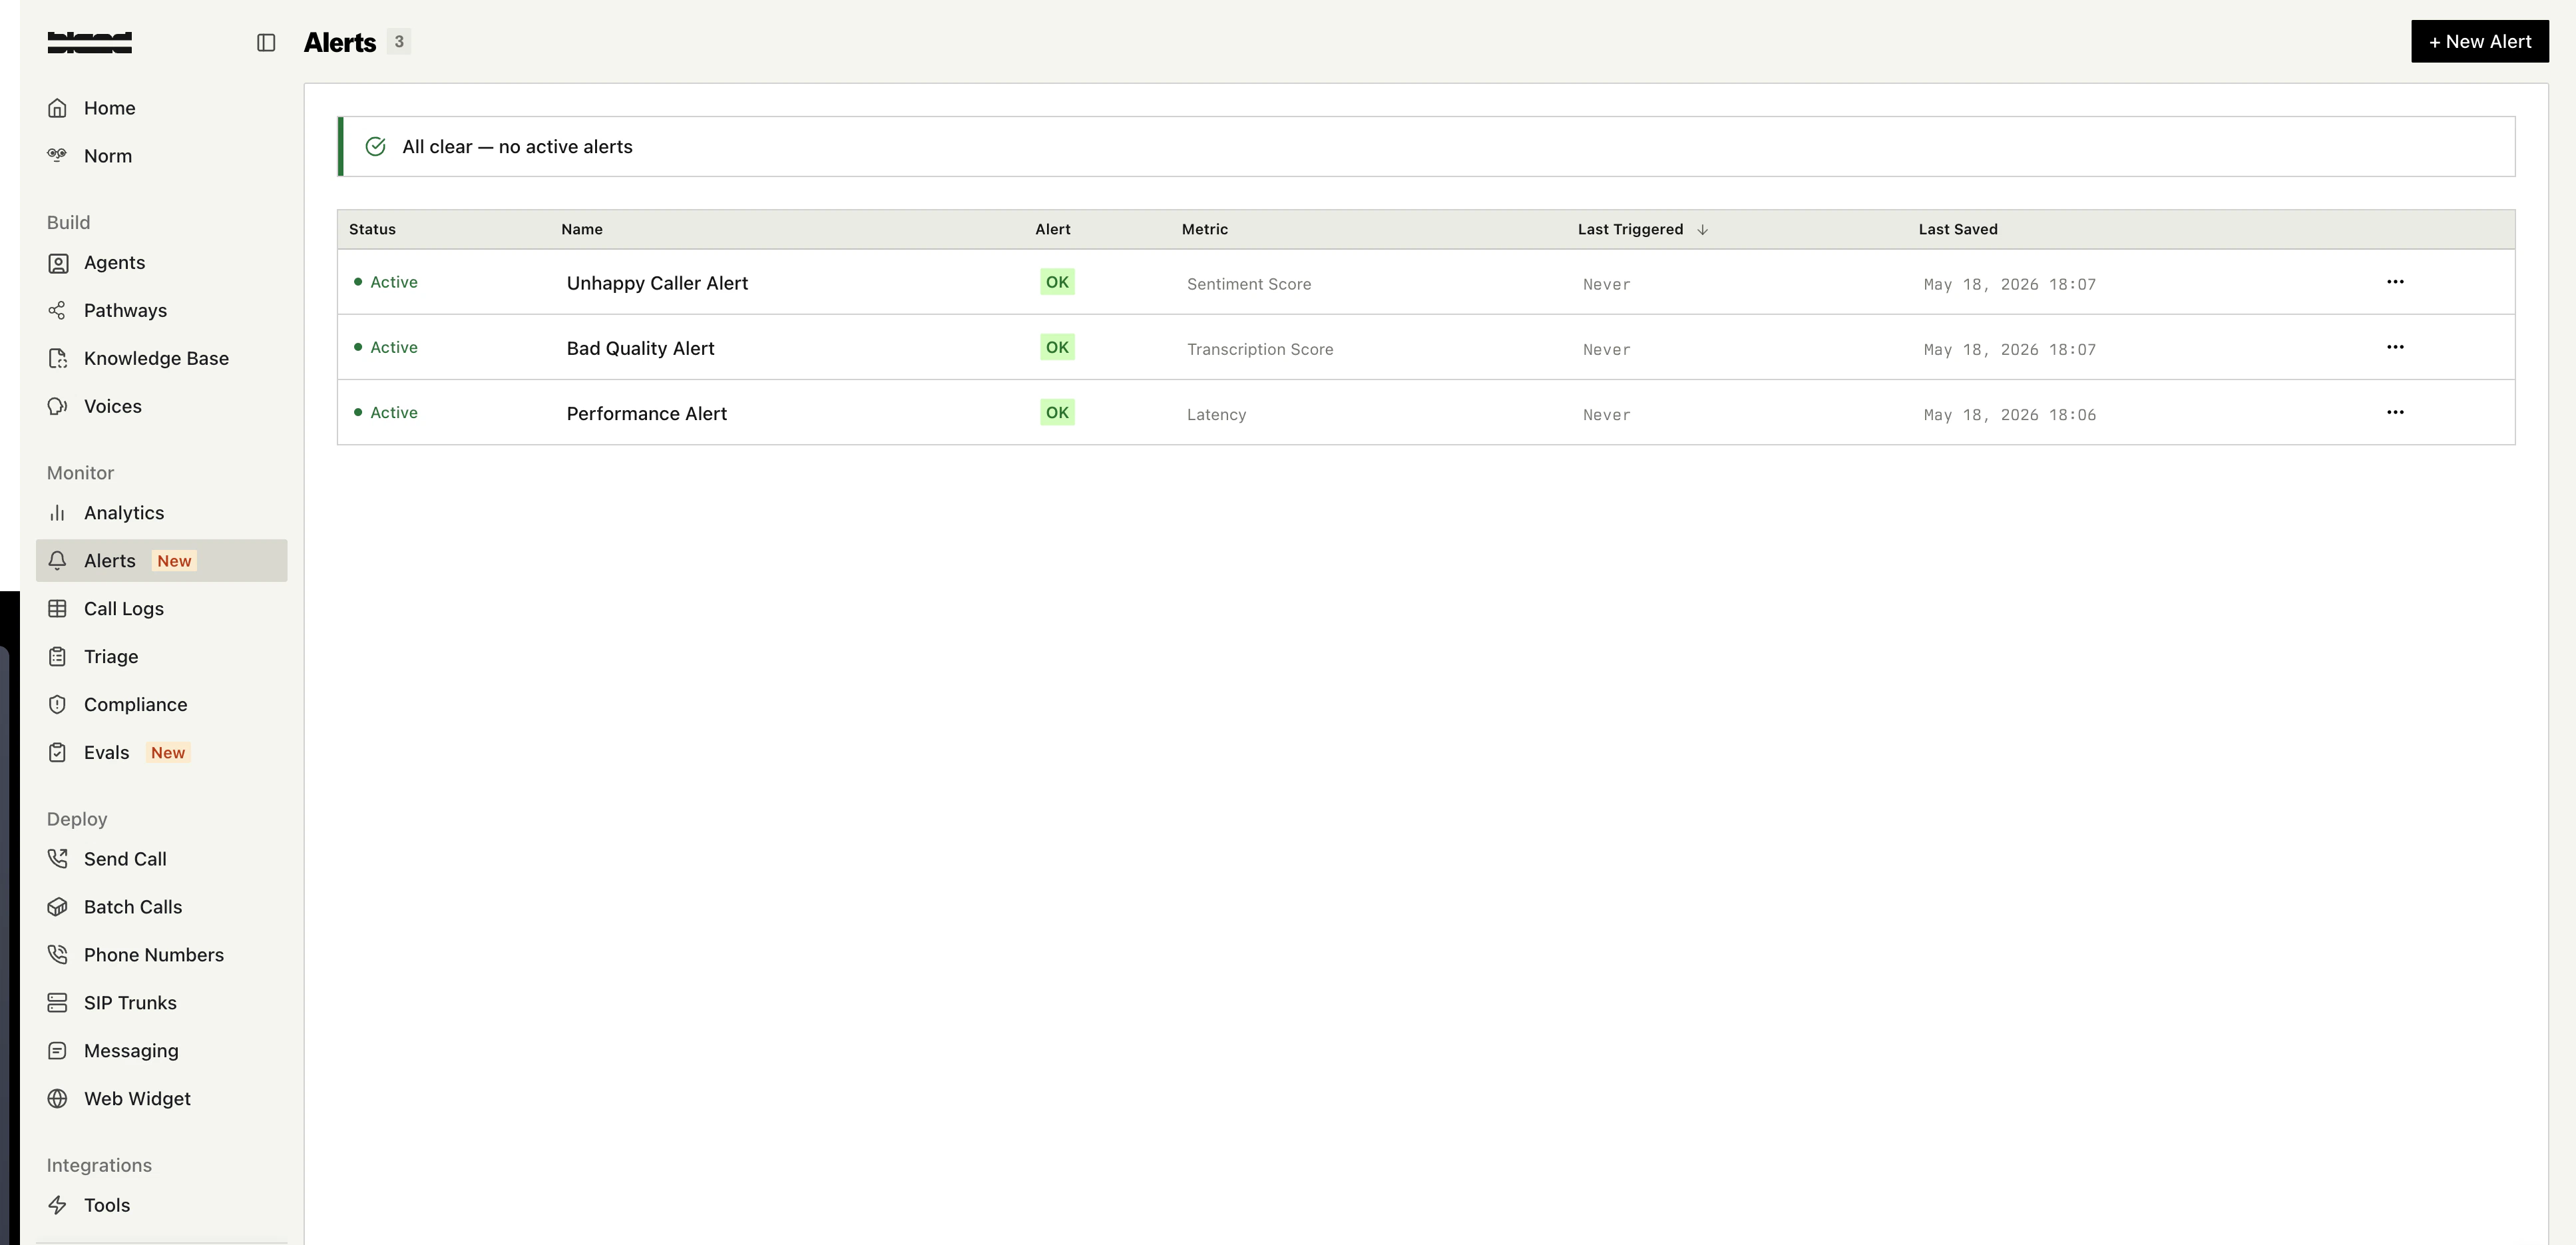
Alert lifecycle
An alert config has two pieces of state visible in the dashboard:- Status: whether the config is Active (currently evaluating) or Inactive (paused). Toggle this without deleting the alert.
- Alert state: the live result. OK if no level is currently breached, or Triggered with a severity badge if one is. The dashboard also shows the time of the last trigger so you can spot patterns.
Docs for agents: llms.txt